Always looking for Open Source data to highlight the capabilities of Microsoft Analytics solutions, I have:
- In 2013, analyzed the number of travelers boarding Transiliens station: Power Query & Power BI
- In 2015, wrote an article on the analysis of security incidents at the SCNF: HDInsight Spark & Power BI: Analysis of SNCF security incidents
- In 2016, analyzed Vélib data: Vélib & Cortana Analytics
- Between 2014 and 2019, wrote articles on wine quality prediction: Predict Wine Quality with Azure ML, SQL Server Machine Learning Services & Wine Quality, Auto Machine Learning from SQL Server
- …
In short, it was time to write a new article and find a new data source! Now « Breton » ☔ (for two years, we have lived next to Vannes) we have suffered the recent bad weather #Ciaran #Domingos
➡️ Why not analyze storms 😀
Looking for APIs to retrieve winds and weather aspects I discovered Meteomatics (The Global Leader in Weather Intelligence). As such, thank you to Matthias Piot and Akemi Narindal-Aoki for their valuable help with the use of the Meteomatics APIs.
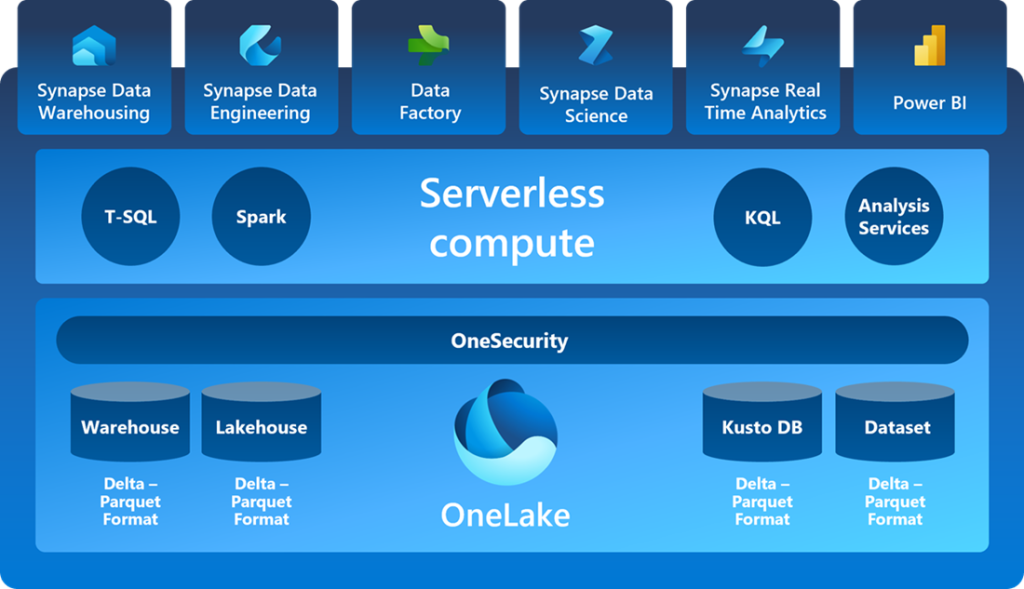
Microsoft Fabric is a complete SaaS analytical solution covering all data analysis needs. It brings together new and existing components such as Power BI, Azure Synapse, and Azure Data Factory into a single integrated environment:
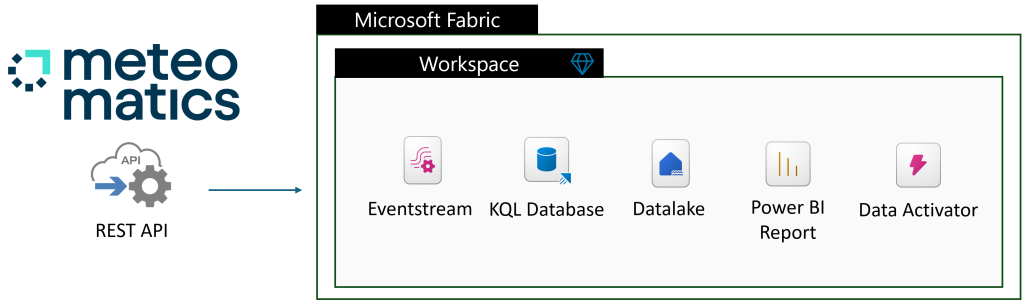
🎯 Here is the architecture of this solution:
- The Meteomatics APIs will be used to collect information on wave height, temperature, wind speed and precipitation.
- The data will be captured in an Eventstream via a Notebook and will feed a Times Series KQL database as well as a Datalake.
- The data will then be analyzed in Direct Lake in Power BI.
- Finally, alerts will be created in order to be proactively alerted to deteriorating weather conditions.
1 – Access to data
ℹ️ This article was written on November 3, 2023.
Meteomatics offers the ability to test their APIs for free (Free Weather API) as well as a Wizards for access to data from a URL, via REST API requests or even via a Python library.
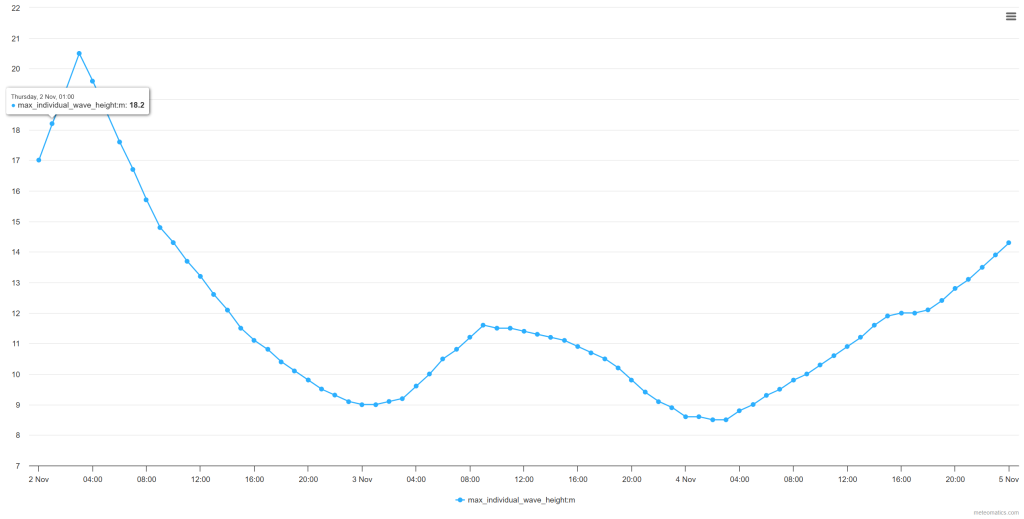
For example, this URL https://api.meteomatics.com/2023-11-02T00:00:00ZP3D:PT1H/max_individual_wave_height:m/47.8118648,-4.3905258/html, allows you to analyze the wave height at Penmarc’h (Lat: 47.8118648 – Lon: -4.3905258):
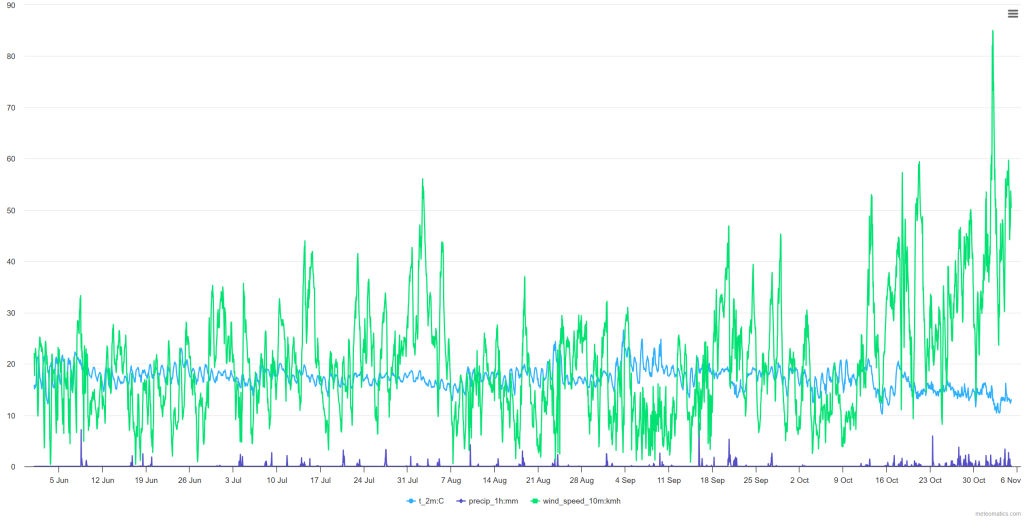
Or even temperature, precipitation and wind speed (https://api.meteomatics.com/2023-06-01T00:00:00Z–2023-11-05T00:00:00Z:PT1H/t_2m:C, precip_1h:mm,wind_speed_10m:kmh/47.8118648,-4.3905258/html):
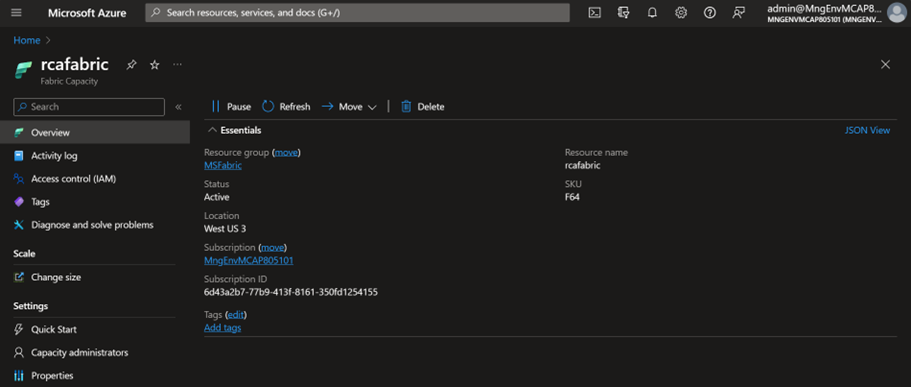
After creating a Microsoft Fabric capacity in Azure “rcafabric” and configuring a new Workspace “Ciaran” on it, I created a Python Notebook to access the Meteomatics data:

![]()
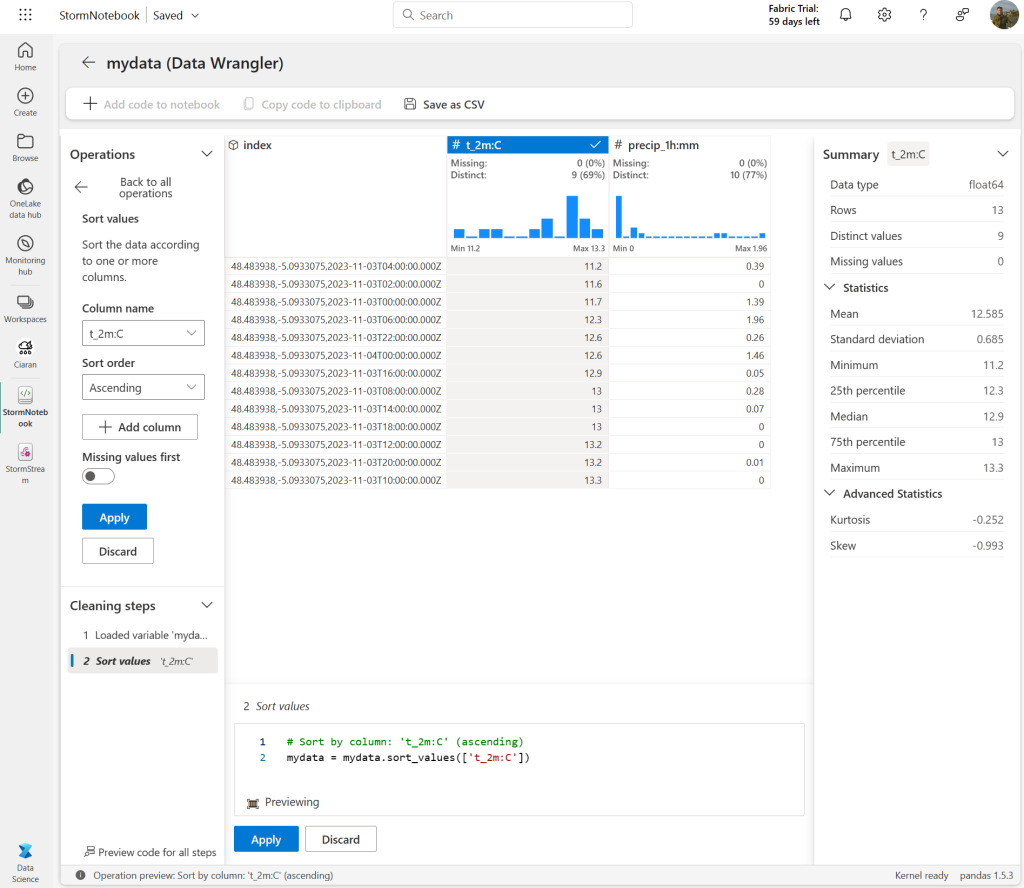
With Data Wrangler available in Microsoft Fabric Notebooks, it is possible to analyze, transform and generate Python code in an intuitive interface:
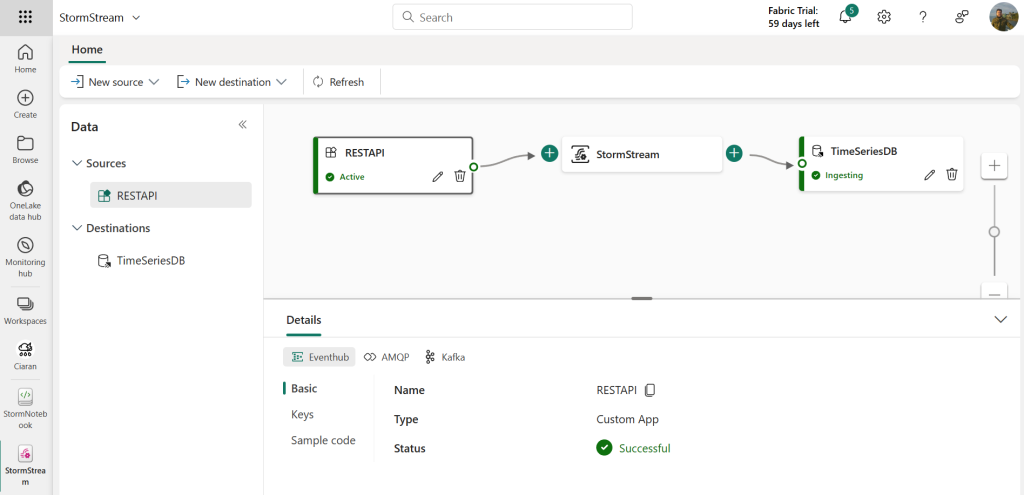
2 – Creating an Event Stream and saving data
The Event Stream feature in Microsoft Fabric allows you to capture, transform, and route events in real-time to various destinations with a no-code experience:
ℹ️ Here is a free tutorial: Real-Time Analytics Tutorial- Introduction
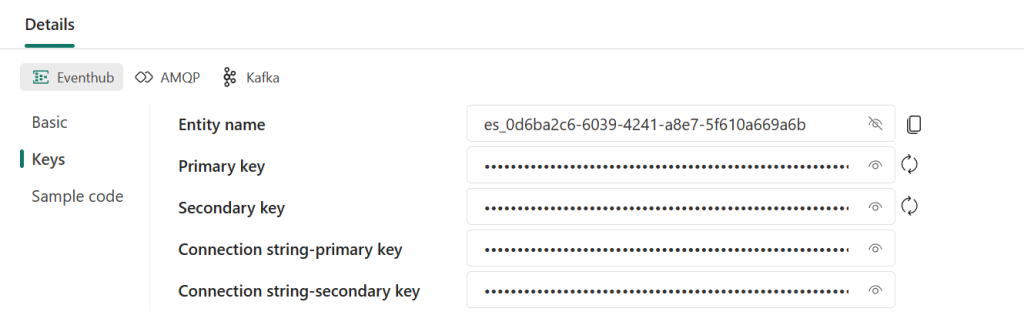
Here the Custom “RESTAPI” application provides an EnventHub entry point which will be used to receive messages received in “real time” from the Meteomatics APIs:
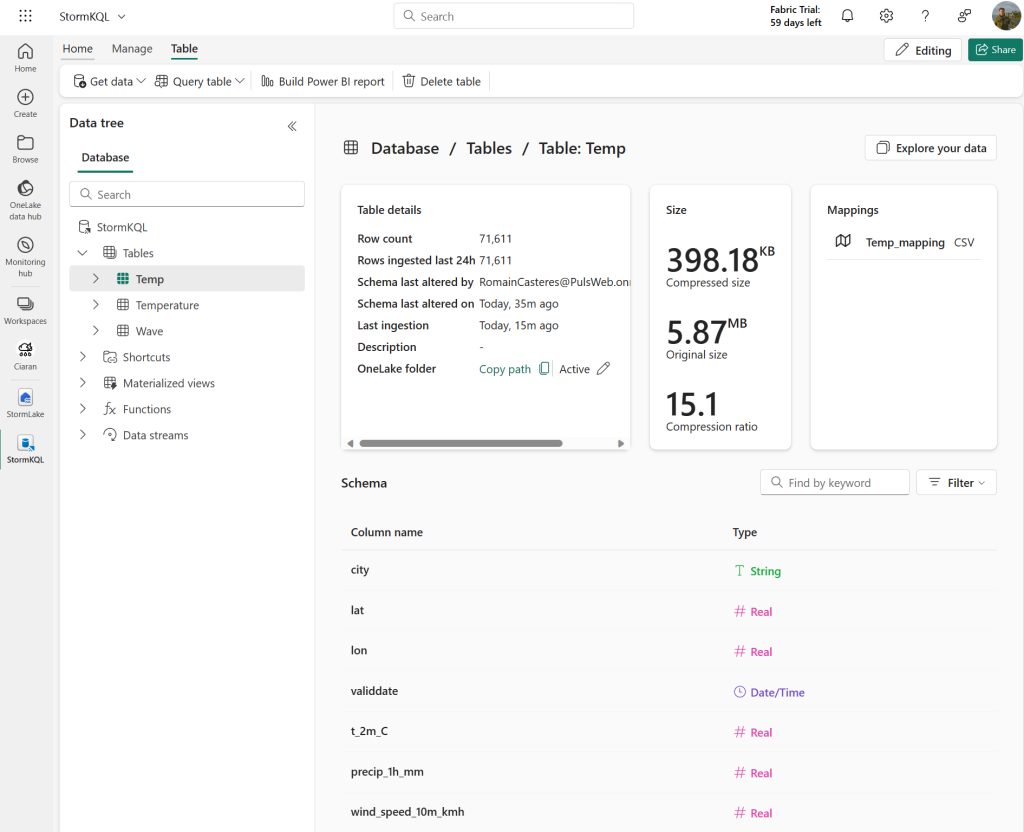
The data is then sent to a KQL database of the Time Series Database type:
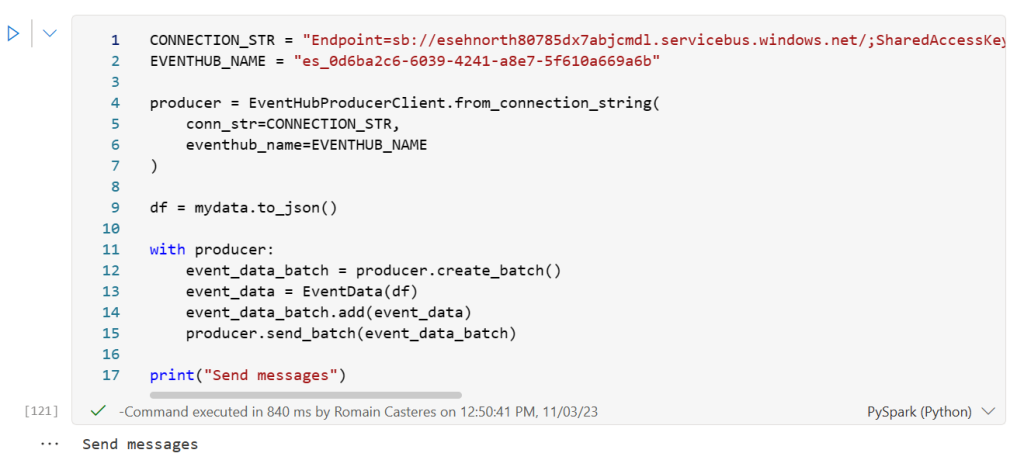
Here is an example of Python code used in the previous Notebook to transmit data to the Custom “RESTAPI” application:
3 – First Analysis
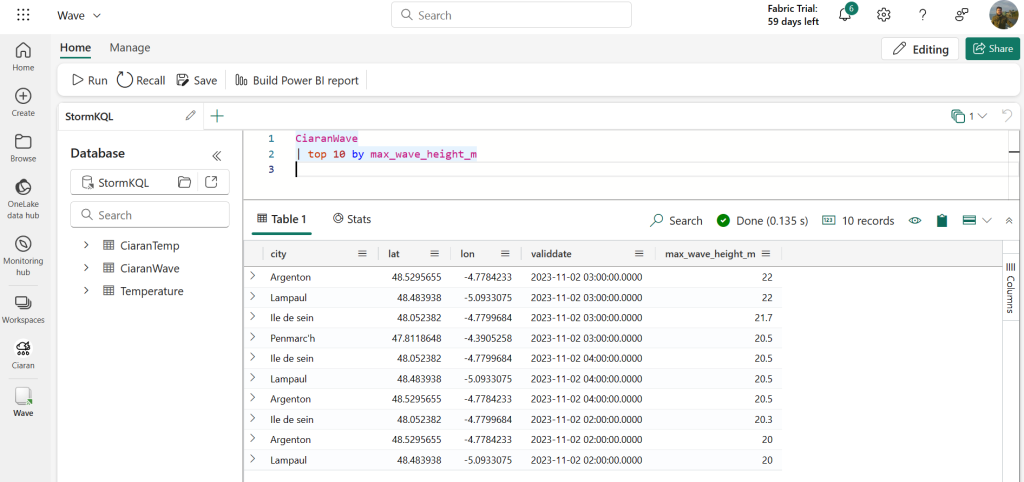
Data can now be analyzed with Kusto Query Language (KQL) and use its advanced features such as Geospatial Data Visualizations, Time Series Anomaly Detection & Forecasting, Windows Functions, …
Here the highest waves:
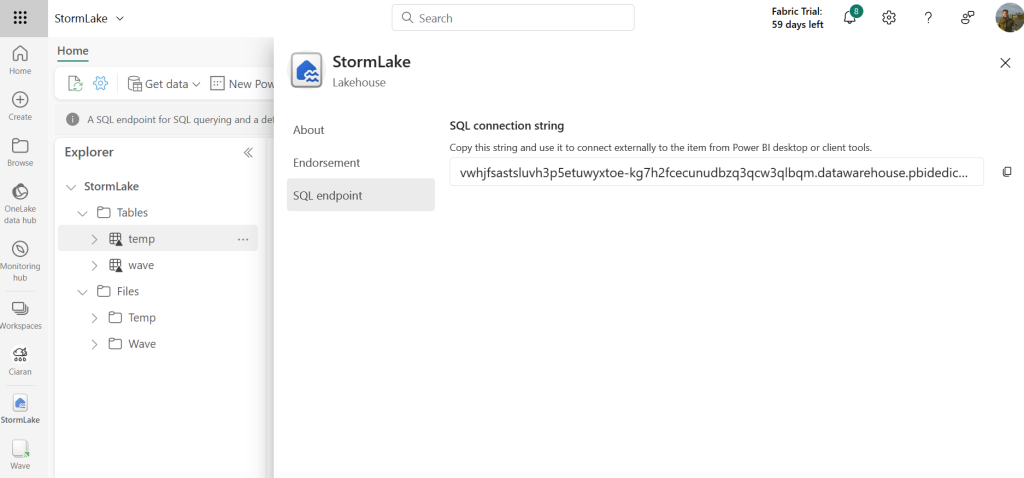
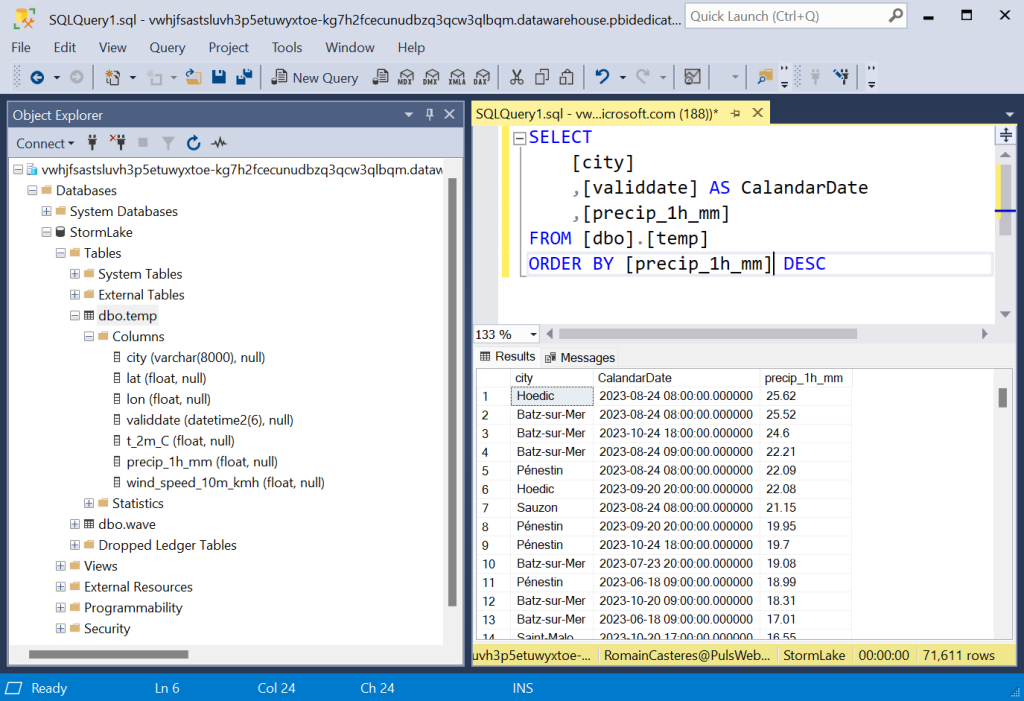
The data is also made accessible on the OneLake (One logical copy), it is then possible to analyze them from the Lakehouse and its SQL Endpoint with tools such as SSMS:
Here the heaviest precipitation:
4 – Creation of the Dataset and a report
After importing the two Calandar and City dimensions into OneLake, I created a new Dataset in Direct Lake mode from the online interface:
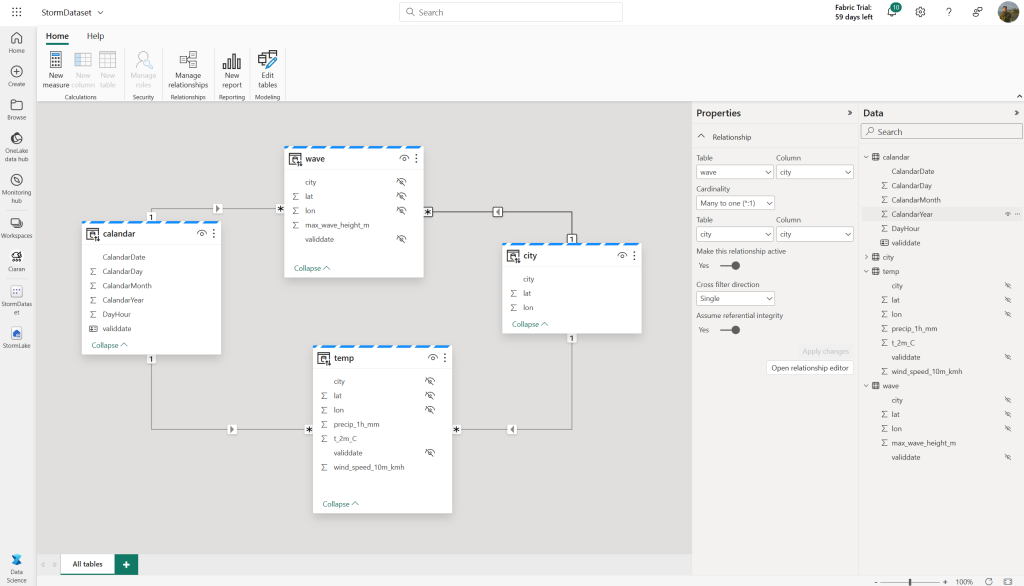
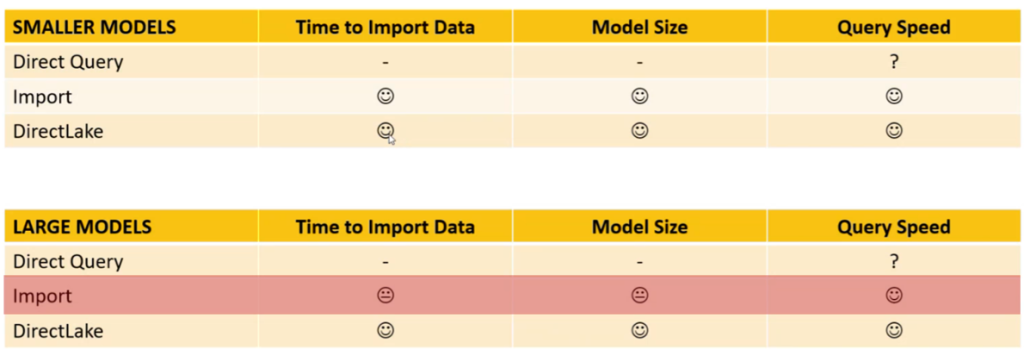
Direct Lake mode offers the best of both modes between Import mode and Direct Query mode: The data will be available in the Dataset without having to configure any refreshes, their access times will still remain efficient.
Here is the report :
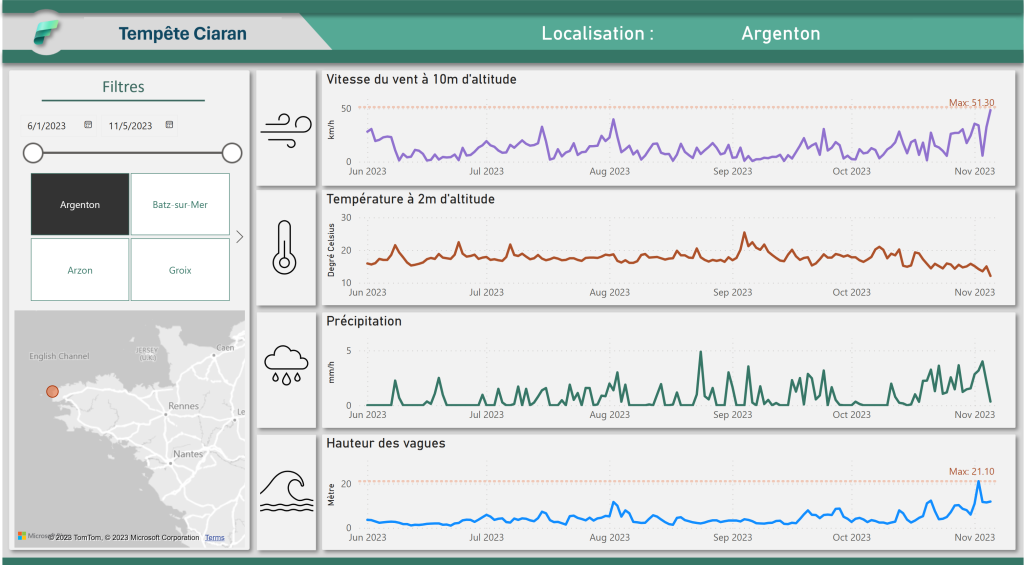
The report is available at the following address: https://app.powerbi.com/view?r=eyJrIjoiYTU1ODMyNGEtNzdhNC00YWFjLTk0MzEtOTViMzU3MGFiYzMzIiwidCI6ImM4OTI4ZWFkLTljMTItNGE5Ny05ZjZmLWU5Mjc0YjYyZjM3MSIsImMiOjh9&embedImagePlaceholder=true
ℹ️ For automatic refreshing of the report: Automatic page refresh
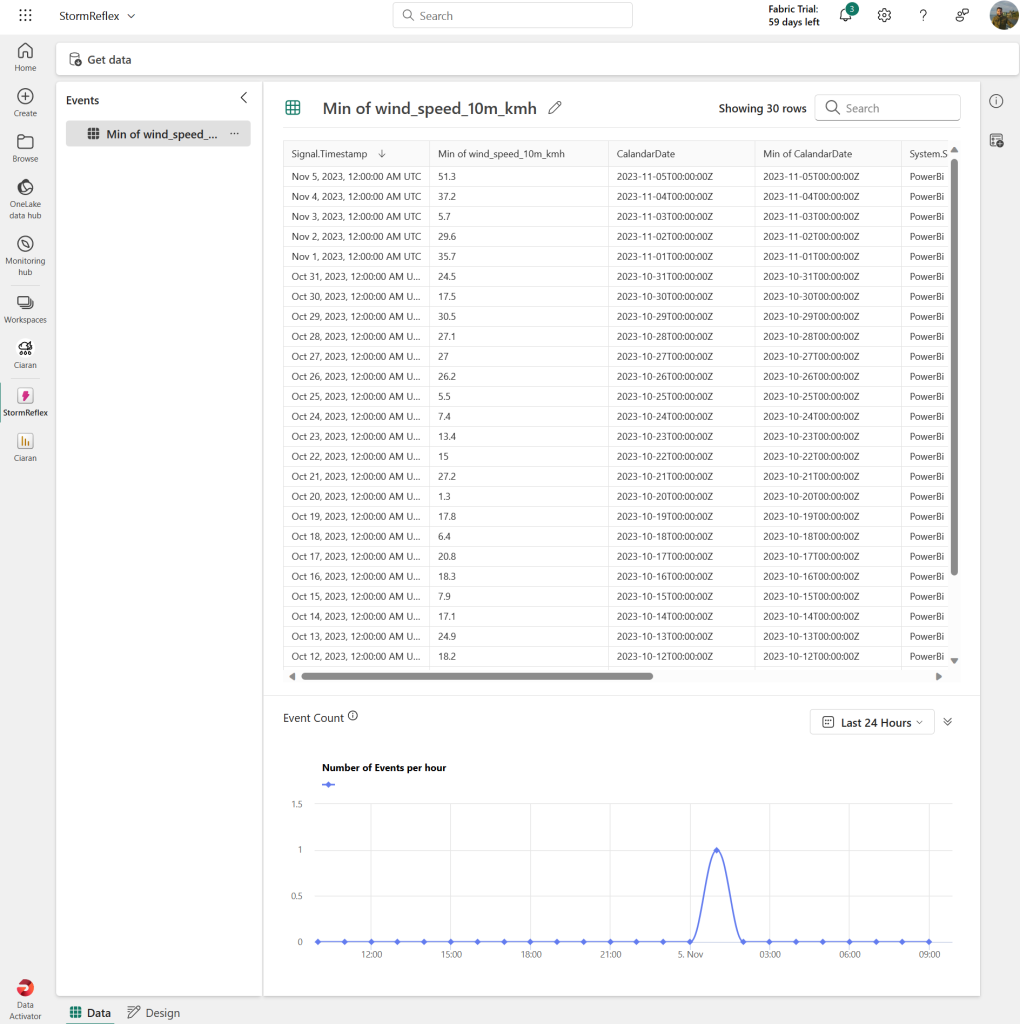
5 – Creation of alerts
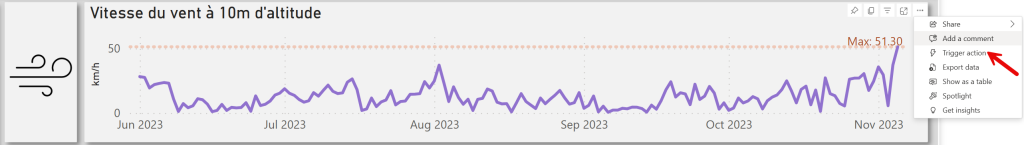
In order to be proactively alerted in the event of strong winds, it is possible to use the automated detection and action system using Data Activator:
Here the configuration of an alert each time in Argenton, the wind speed, at an altitude of 10m, exceeds 50 km/h:
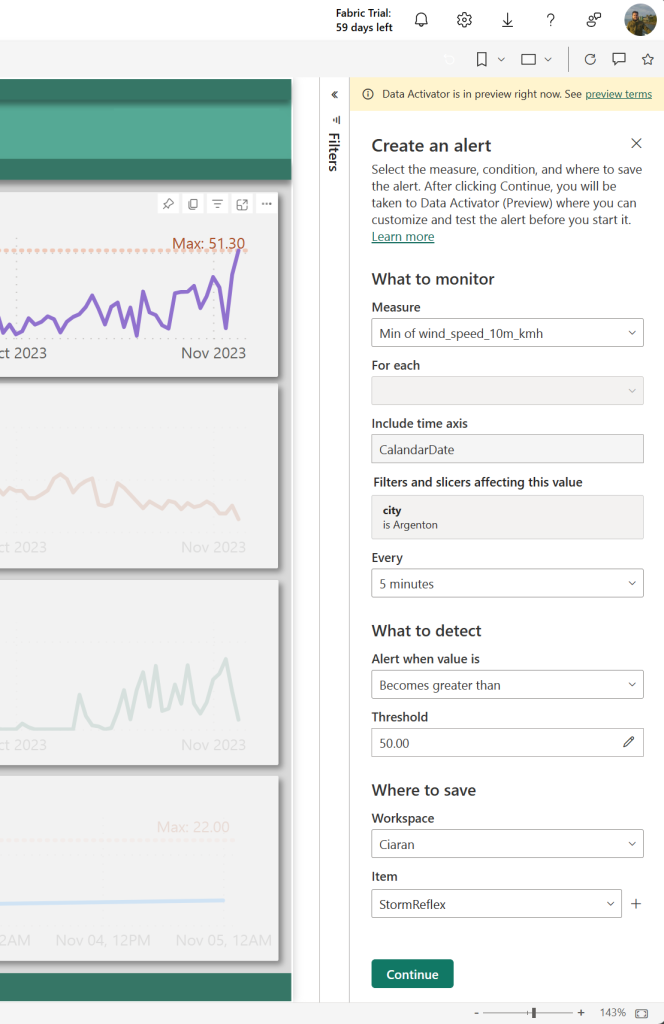
These events are saved in a Reflex allowing data to be monitored to trigger alerts and automated actions:
In the Design part, we have the ability to specify an action if the alert threshold is reached:
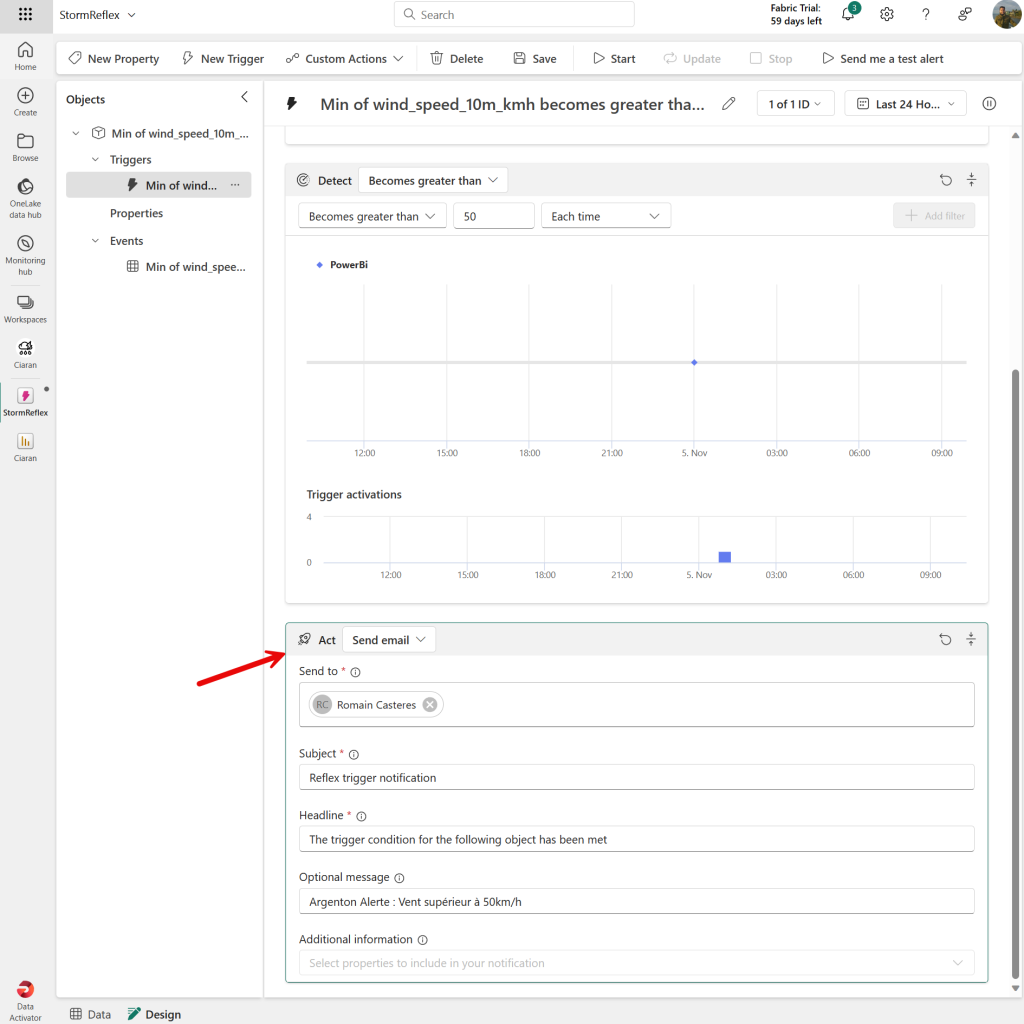
ℹ️ Tutorial : Data Activator tutorial using sample data
It is possible to create much more complex alerts and actions, particularly with Power Automate: Use custom actions to trigger Power Automate flows
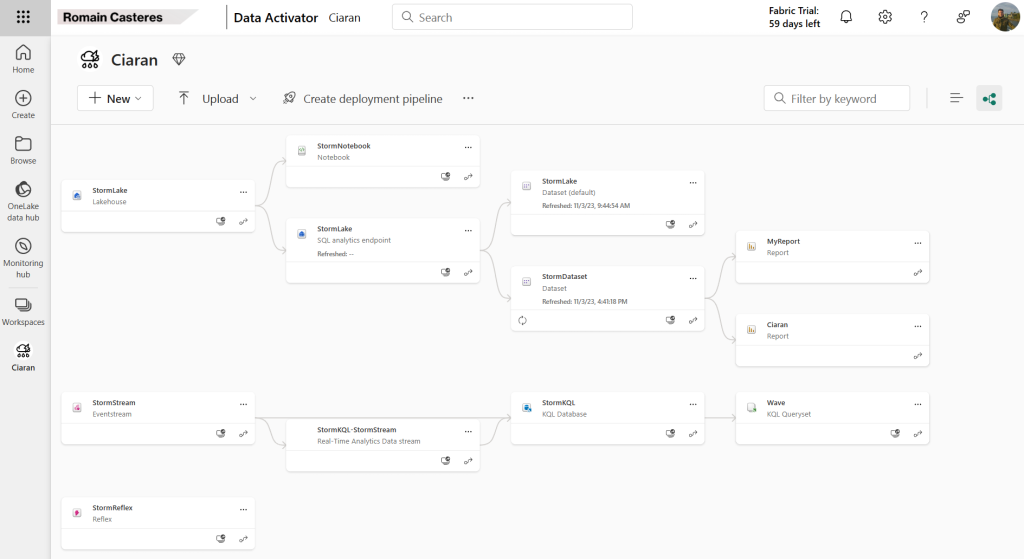
In this article we analyzed data from an API with Microsoft Fabric. The unified platform greatly simplifies data project architectures and accelerates developments 🚀
Here are the objects created in my Workspace in a few minutes:
📢 Microsoft Ignite is an annual conference for developers and IT professionals. During the next one which will take place from November 15 to 16, 2023, many announcements will be made around Microsoft Fabric, do not hesitate to register: https://ignite.microsoft.com/
In the meantime, here is the Roadmap: aka.ms/FabricRoadmap
Always looking for new data sources, don’t hesitate if you have ideas other than transport, wine or even storms 😀